I’ve always loved playing basketball since I was little. My dad used to tell me that the way we play in our favorite sport reflects part of our personality we may not notice in our day-to-day life. He was right! I’ve never been too aggressive in life or in the game, which could be either a good or a bad thing. However, I realized that if my personality could influence the way I play, maybe influencing my skills in basketball could help me in life. That’s why I’ve always tried to play and practice basketball to improve my game skills but also my life skills.
For this project I decided to create a Dashboard in Streamlit that helps anyone interested in improving their basketball skills, know where to focus their training based on their height, weight, and current skills compared to the 2023 NBA players. That way we could spend less time worrying and more time improving. The question that guided this project was “What basketball skills should any person have if he was an NBA player?”.
Data Gathering
In order to answer my question, I had to come up with some metrics that NBA players and people in general had in common. The first thing that came to my mind was using physiological metrics like weight, height, age, or anything similar that was recorded for NBA players. Additionally, I needed to find the characteristics or skills that were easy to measure or compare between NBA players that were applicable to anyone trying to improve their game.
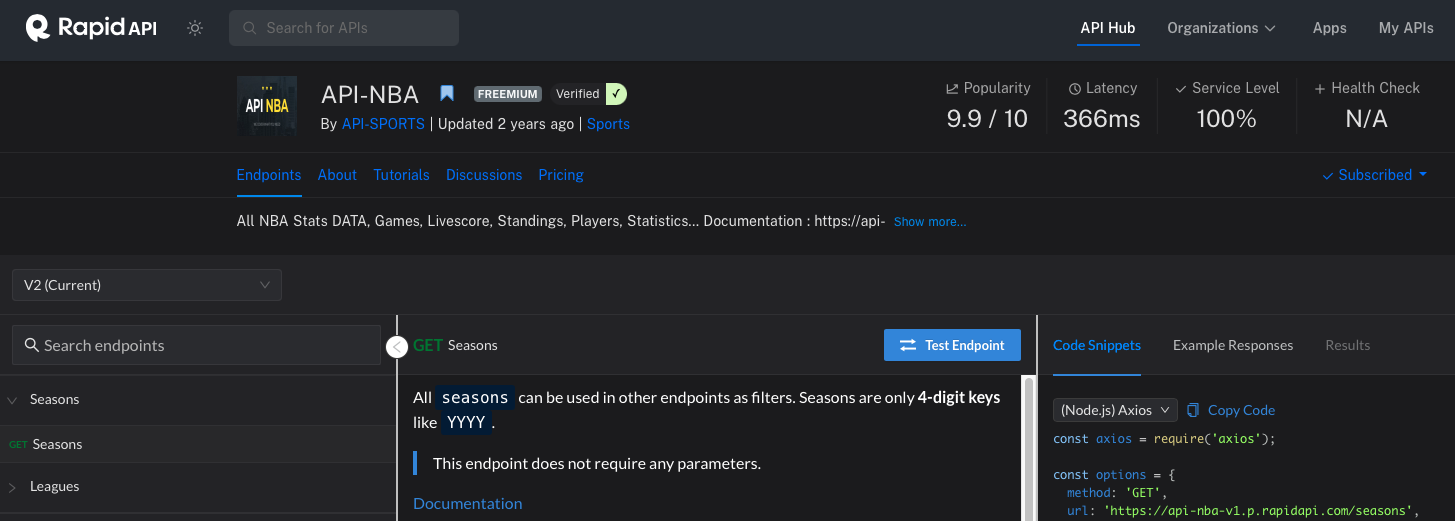
After doing some research in various websites including the official NBA official site, I found that the easiest/cheapest and most ethical way to gather the data was through one or multiple free APIs that would give me all the stats and data I was looking for. Fortunately, from the various APIs I looked into, I found one that contained all the information in the rapidapi.com website. Which included easy documentation you could just copy and paste to find the information of interest.
Challenges With the Data
Unfortunately, the data was spread in different endpoints of the API, so I had to make multiple requests to gather the data and turn it into tables I could grow, clean and join. Just to give you a quick glance of the data. There were 66 registered NBA teams for 9 seasons. For each season each team had up to 15 players. If we do the math right ((66*9*15) + 66), I would’ve needed to do about 8,976 requests to grab the stats and data of each player. Quite a lot! Which wouldn’t be a problem if we didn’t have a limit of 100 requests per day. So, for the sake of the project and to make things easier to reproduce, I chose to use only the 31 NBA active teams for the 2023 season, giving me a total of 640 requests. Definitely more manageable!
Making Things Look Pretty
Since the requests were in JSON format, they looked like dictionaries inside a dictionary, so I turned them in to Data Frames and extracted the information of my interest into new columns. For example, I created a new column with the height in meters, since my height column had a dictionary with height in meters and inches.
p_df['height_m'] = p_df['height'].apply(lambda x: float(x['meters']) if x['meters'] else None)
As I was looking at the player’s information, I made sure the columns were in the right formats and removed any rows with missing information since I would not be able to use it for my dashboard.
# Change to Date format
p_df['birth_date'] = p_df['birth'].apply(lambda x: pd.to_datetime(x['date']) if x['date'] else None)

# Drop NAs
p_df = p_df.dropna()
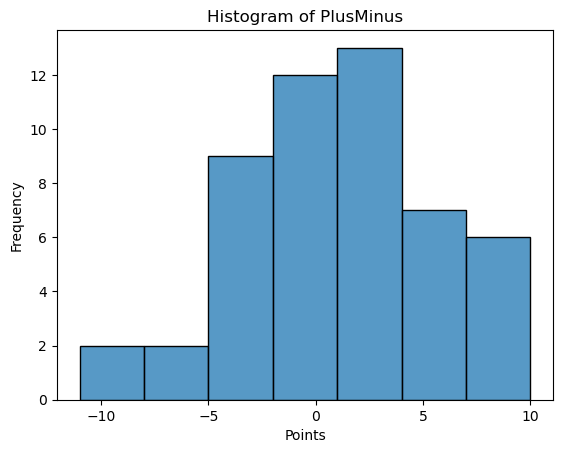
I also added many columns that would be useful including age, player overall performance, biggest strength and biggest strength and biggest weakness. All of them coming from the other columns. For example, after looking at the “plusMinus” histogram, I was able to determine a range of negative and positive points added on average while the player is on the court to determine his performance on average in a game.
Putting Things Together
There were two columns I was adding the information for each request, “players_df” which contained all my players information, and “stats” which contained all the stats for each game of each player in the season. For the second table, I had to group the information by player and take the mean of the player stats.
# Group stats by Player
ps = ps.groupby('id').agg({
'name': 'first',
'team': 'first',
'pos': 'first',
'game': 'count',
'points': 'mean',
'min' : 'mean',
'fgm' : 'mean',
'fga': 'mean',
'fgp': 'mean',
'ftm' : 'mean',
'fta': 'mean',
'ftp': 'mean',
'tpm': 'mean',
'tpa': 'mean',
'tpp': 'mean',
'offReb': 'mean',
'defReb': 'mean',
'totReb': 'mean',
'assists': 'mean',
'pFouls': 'mean',
'steals': 'mean',
'turnovers': 'mean',
'blocks': 'mean',
'plusMinus': 'mean'
}).reset_index().round()
# Add to our existing table
stats = pd.concat([stats, ps], ignore_index=True)
# Add my players info with their stats
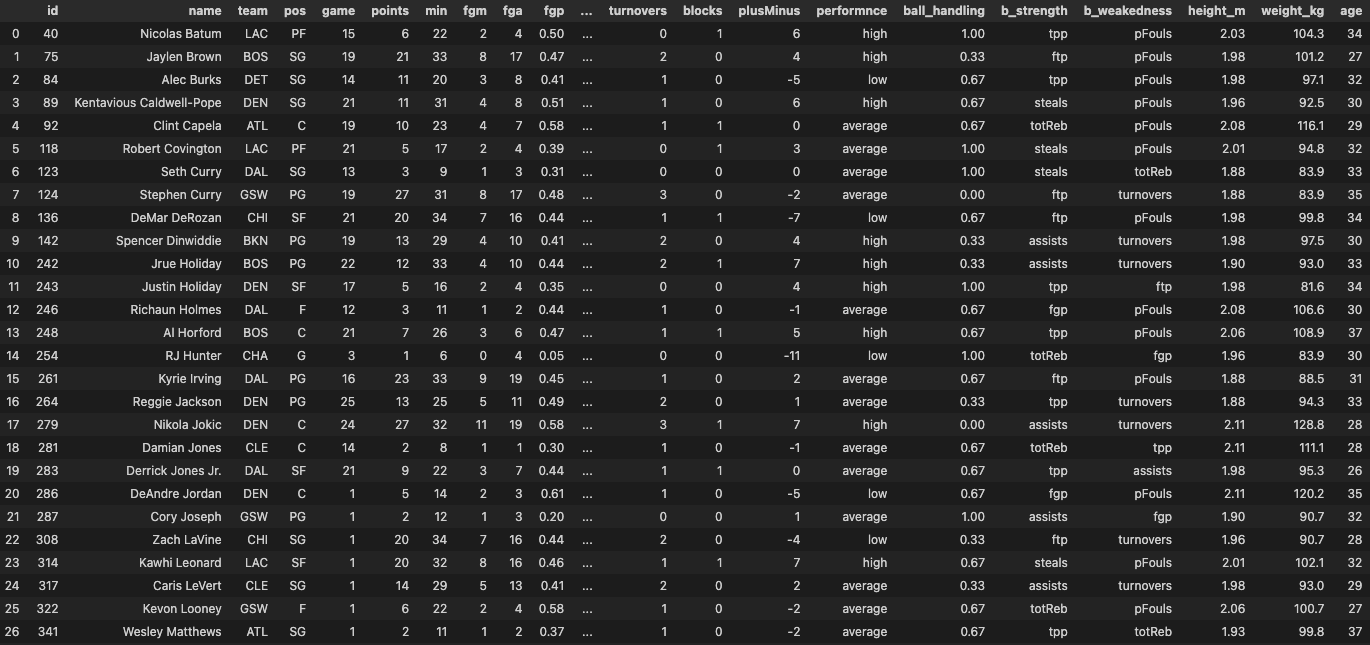
final_df = pd.merge(stats, players_df[['id', 'height_m', 'weight_kg', 'age']])
This is how the table looks like at the end:
When people say data scientists take 80% of their time gathering and cleaning their data, they are not joking. This was time consuming, but I enjoyed the process, and even more the final outcome. You can look at my repository for the complete version of my code if you want to replicate my data. You will also find there the temporary tables I mentioned in this blog as csv files and my final table called “final_table.csv” which I will use for my next blog “My NBA Exploratory Data Analysis”, so stay tuned!
Happy Data Wrangling!