Welcome back! In this article, I am going to walk you through my thought process to explore the data of NBA players from the 2023 Season. If you want to look at where I got this data and how I cleaned it, you can read my NBA Players Data Collection and Cleaning article. So, let’s dive in!
Defining My Direction
Starting with the end in mind is crucial when doing an exploratory data analysis because if you don’t have clear what questions you want to answer with your data, you won’t deliver valuable results with your efforts. It is like sailing a ship without a compass.

If you recall from my previous article, the question that was driving my project was “What basketball skills would a person need to have if it was an NBA player?” However, after having my data ready to be explored, I realized my question was too broad, and decided to ask further questions to refine my direction in my analysis. So, after looking at some of the distributions of my data and having condensed all the questions I was asking myself, I came up with the following:
- What are the most relevant stats someone needs to know to improve their game?
- Does the number of points determine how well you performed in a game?
- Is there a correlation between height and weight?
- Can height determine the position of a player?
- Can your position determine your performance and skills you should focus on?
These questions would ensure I don’t do unnecessary work and I can actually gain valuable insight for my initial question of interest.
Generating Plots That Answered my Questions
Is there redundancy between stats?
First, I wanted to know what were the most relevant stats or skills that someone needed to know so they could improve their game. In my data set, there were 21 stats, which are too many to focus on at the same time. In addition, I thought some of them could be redundant, so I decided to explore those a little more through a correlation heatmap.
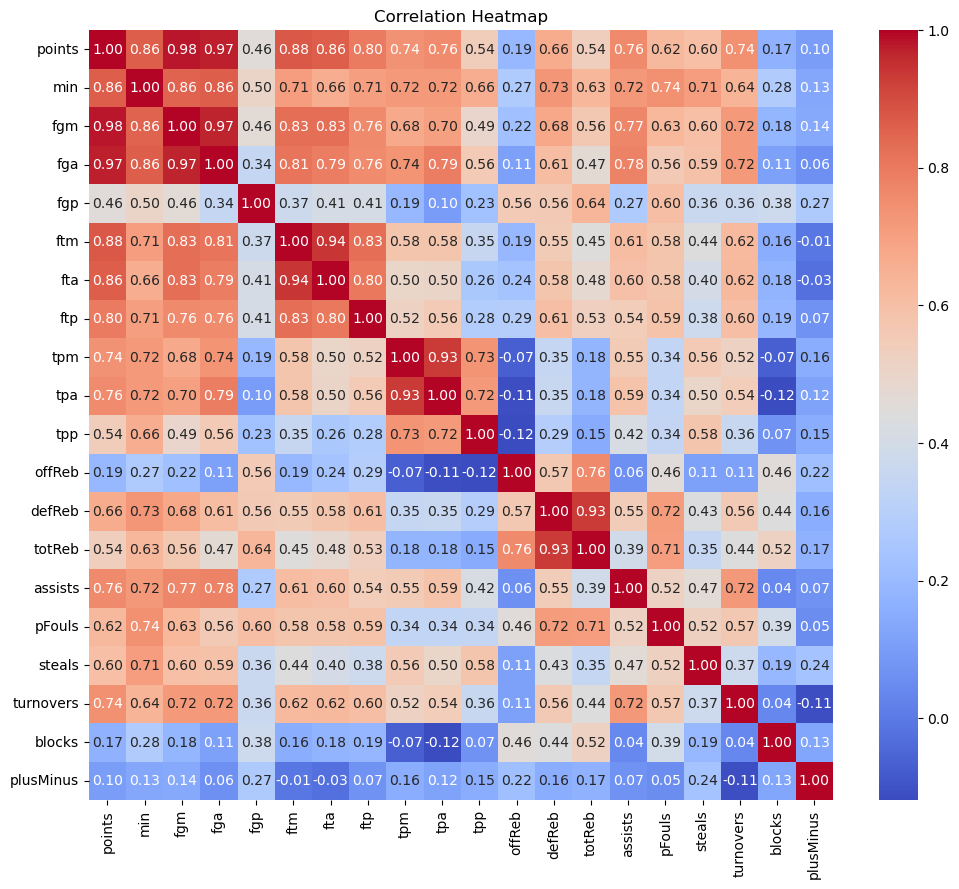
Looking at the Heatmap, we can identify several variables that are highly correlated with others with a high saturation of red. We can see that they presented the most redundancy in information. For example Field Goals Made (fgm) and Field Goals Attempted (fga) could be represented by Field Goal Percentage (fgp), Free Throws Made (ftm) & Free Throws Attempted (fta) could be represented with Free Trhow Percentage (ftp), similar with Three Points Made (tpm), Three Points Attempted (tpa), Offensive Rebounds (offReb), and Defensive Rebounds (defReb).
I also learned that the minutes someone spends on the court are highly correlated with almost all variables, which makes sense because the more you play, the more chances you have to increase your stats. However, the correlation is even stronger with “points”, “fgm “and “fga”, which I found very interesting. Should I try to shoot more to stay on the court more? Maybe.
The more points, the better your performance?
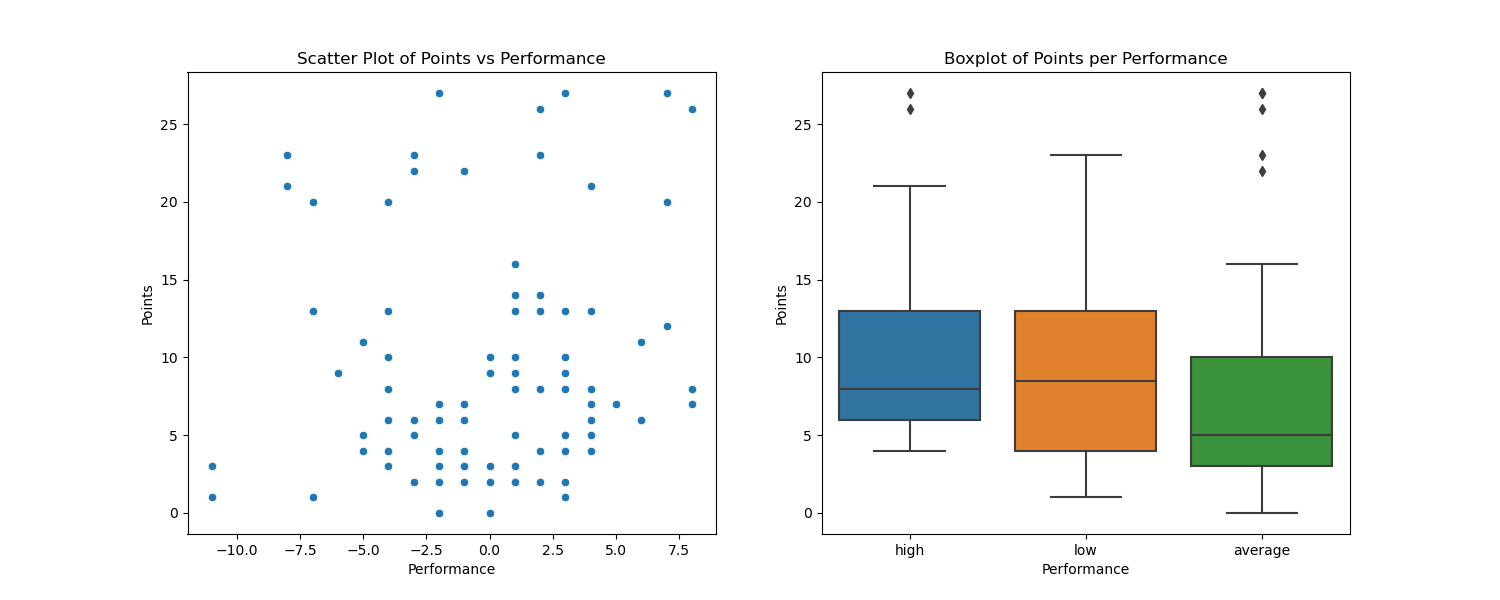
I was really curious to see if the people that scored more points would be considered better performing, but based on the scatter plot which compares the “points” and the “plusMinus” variables (plusMinus is the point differential when a player is on the court), and the boxplot with the performance vs points, it looks like there is no relationship at all between them. Therefore, we shouldn’t worry about making the most points in a game but on using your skills to help the team win the game. Our skills may be different, but they all are important for the outcome of a match.
Would I be missing important information if I focus on just using height and not weight?
I’ve always thought that simplicity helps things become clearer, so I didn’t want to use weight because I thought it wouldn’t be adding too much insight. Usually, the taller you are, the more you weigh, but that is not always the case. So, I wanted to figure it out by creating a scatter plot with these variables.
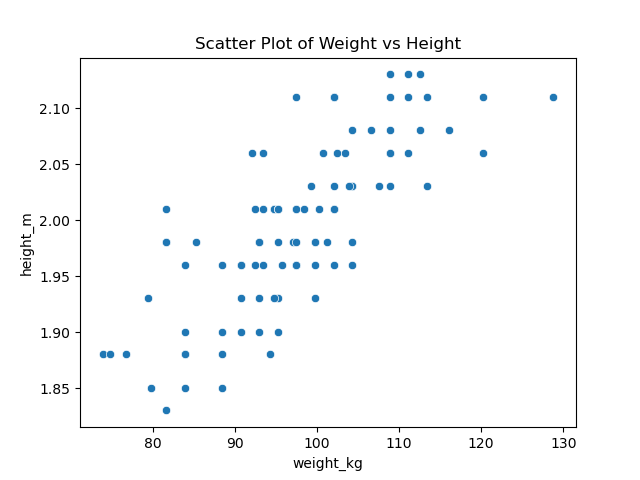
And it is linear! It’s not perfect but good enough for me to just use height as an input in my dashboard.
Can height determine the position of a player?
I am pretty sure you have heard someone saying to a really big guy; “Hey, do you play basketball? You should be a center.” Is that true in the NBA? Would that apply to the other positions as well? Let’s find out.
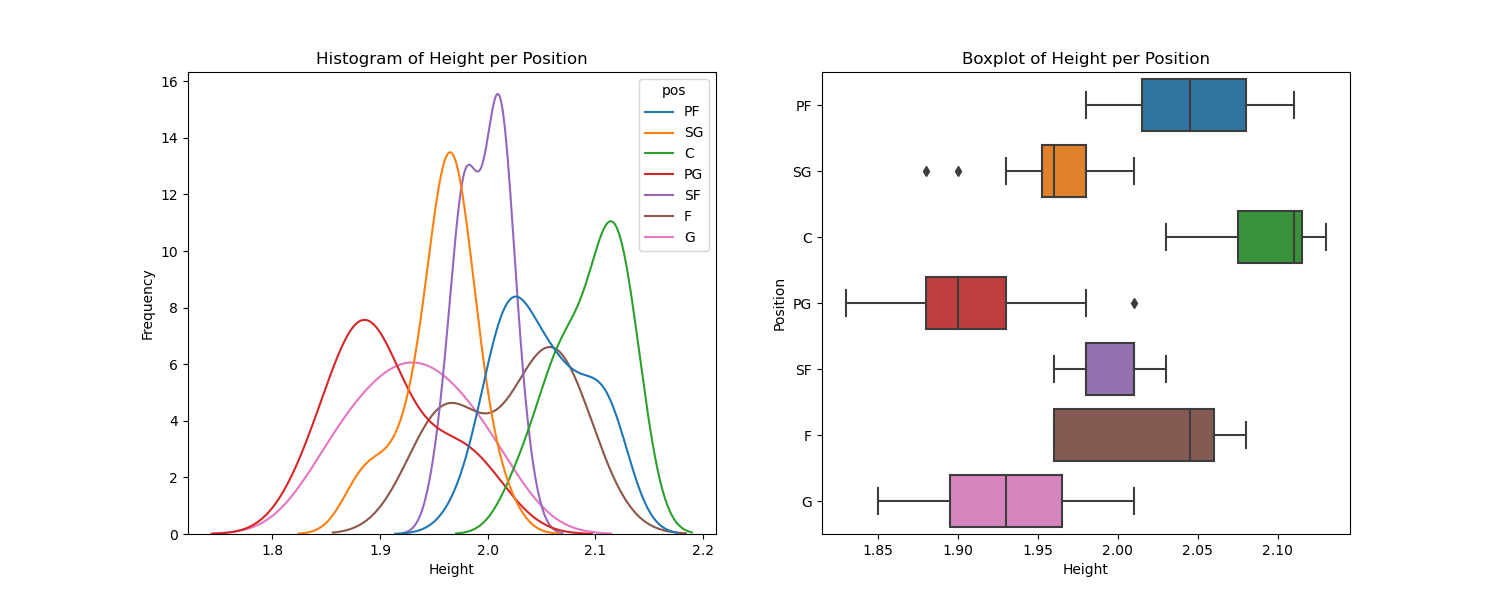
Based on this graph, you are probably checking what positions would be the best for you. And yes, the min height is 1.83 meters, but I would just round up my height to that minimum if it is below it. For some heights, there is more flexibility as to what positions to have, but others have fewer options, especially the extremes.
Can your position determine your performance and skills you should focus on?
We just saw that points by themselves don’t matter to be a high-performing player. But will position have any influence on that? I doubt it.
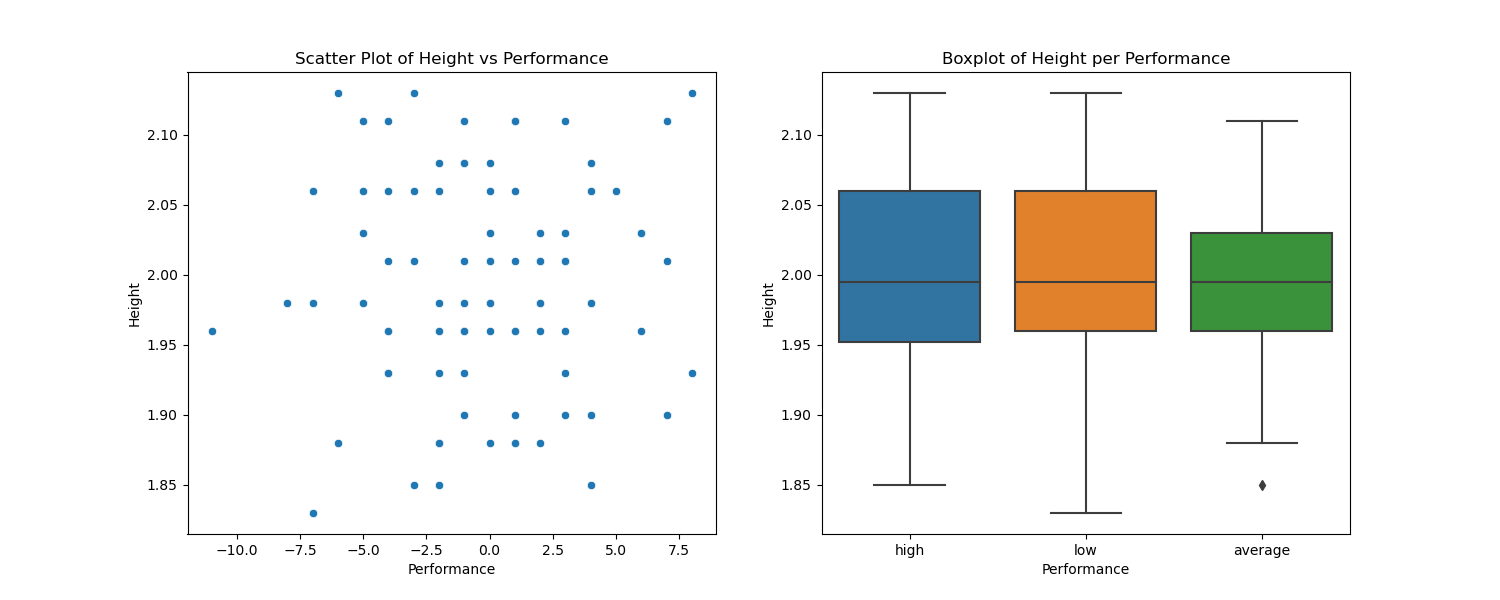
As expected, there is no relationship at all. As long as you master the skills your position has, you will be alright. To take a look at what those skills are for each position, I created bar plots for each position that count the biggest skill for all players with the same position. The following is an example for the Power Forward Position.
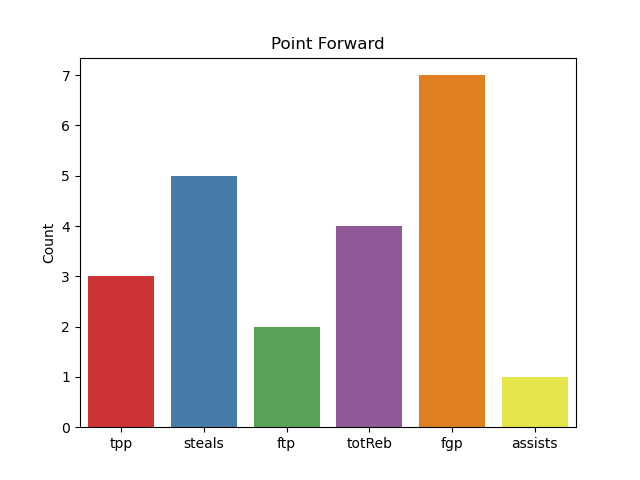
As you can see, shooting from the 2pt area is the biggest strength of most NBA players with a position of Point Forward. Followed by good steals and good rebounds. So I would say that if someone is interested in this position they should focus on mastering those 3 skills
Conclusion
Exploring this data gave us many valuable insights. I learned that some of the skills are redundant and have a high correlation with each other. I also learned that a player’s performance is not determined by just the number of points scored in a game or the position where he plays, but it is a combination of applying the right skills for a specific position. With that in mind, we are now ready to take our exploratory data analysis to the next level. Yes! I created an interactive Dashboard that will allow you to explore the positions that would fit you based on your height, the skills you would need to master for a position of interest, and what your basketball skills should look like on average in a game for a given height and position. Click HERE to access the Dashboard.
Hope you were able to find your findings through the visualization I displayed, feel free to visit my GitHub repository to look at the full Exploratory Data Analysis and the code to make the graphs I displayed.
Happy Exploring!